
Sales Pipeline
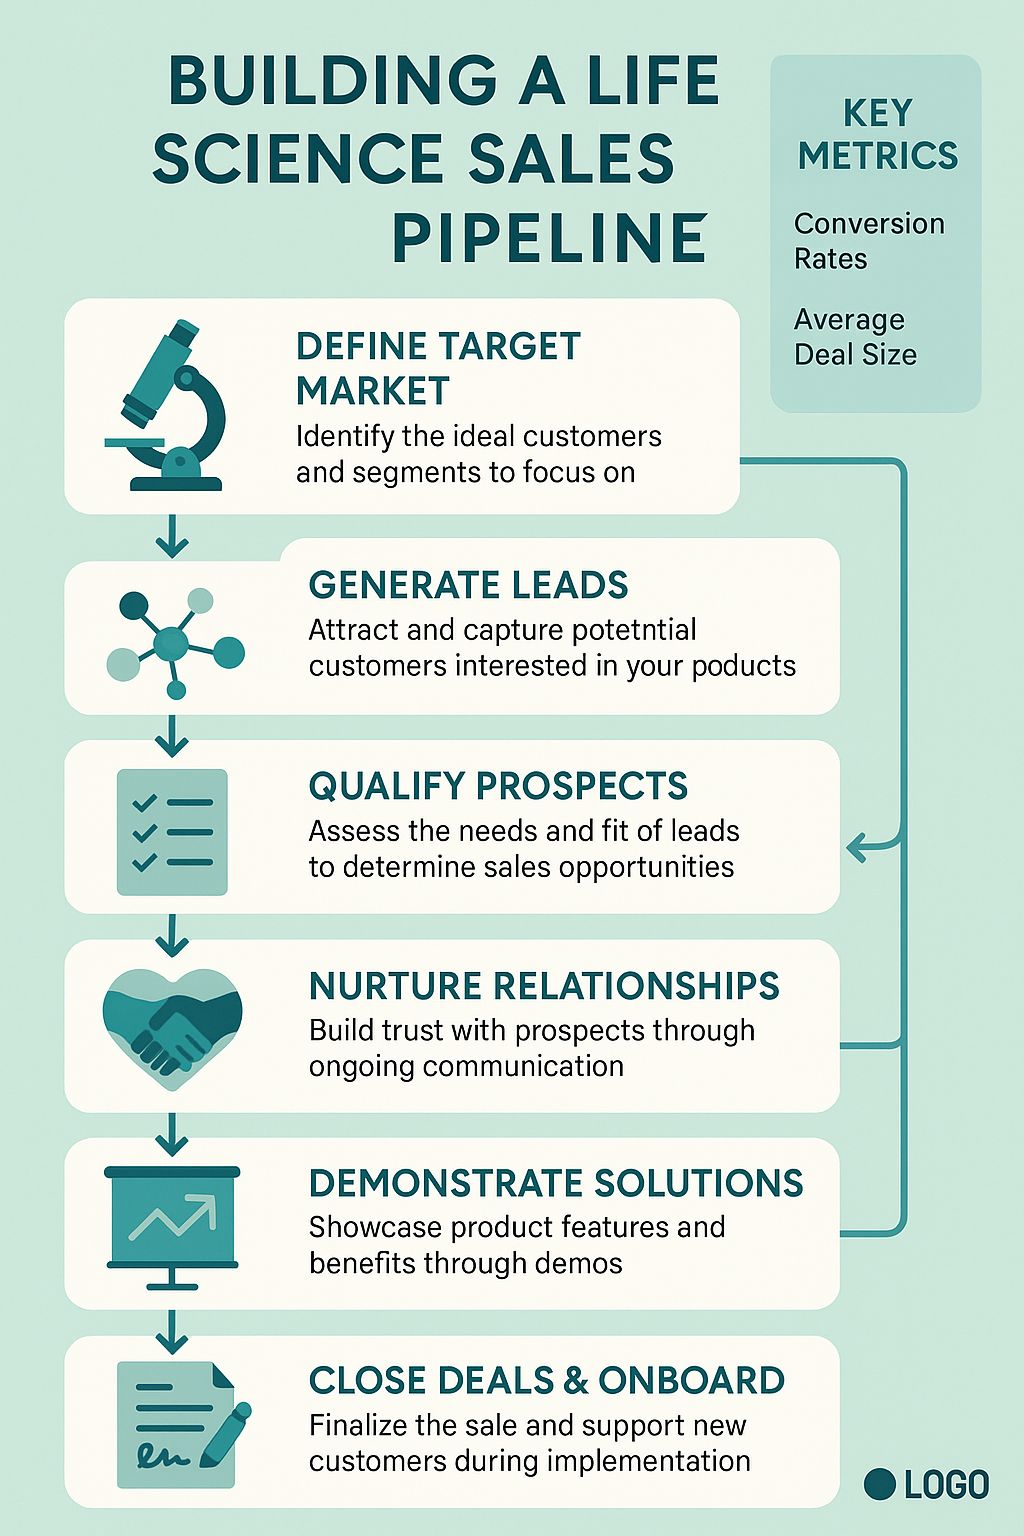
The infographic details a six-step sales pipeline designed for the life science industry. Starting with 'Define Target Market,' the pipeline emphasizes identifying ideal customers and segments, represented by a microscope icon. The process then flows to 'Generate Leads,' focusing on attracting potential customers, visualized with an atom-like icon. Next is 'Qualify Prospects,' which involves assessing leads and determining sales opportunities, indicated by a checklist icon. 'Nurture Relationships' follows, highlighting the importance of building trust through ongoing communication, symbolized by a handshake within a heart icon. The fifth step, 'Demonstrate Solutions,' showcases product features through demos, represented by a presentation screen with a graph. Finally, 'Close Deals & Onboard' aims to finalize sales and support new customers during implementation, visualized with a document and pen icon. Arrows illustrate the progression between steps. A 'Key Metrics' section lists 'Conversion Rates' and 'Average Deal Size' as important performance indicators. A logo is located at the bottom right.